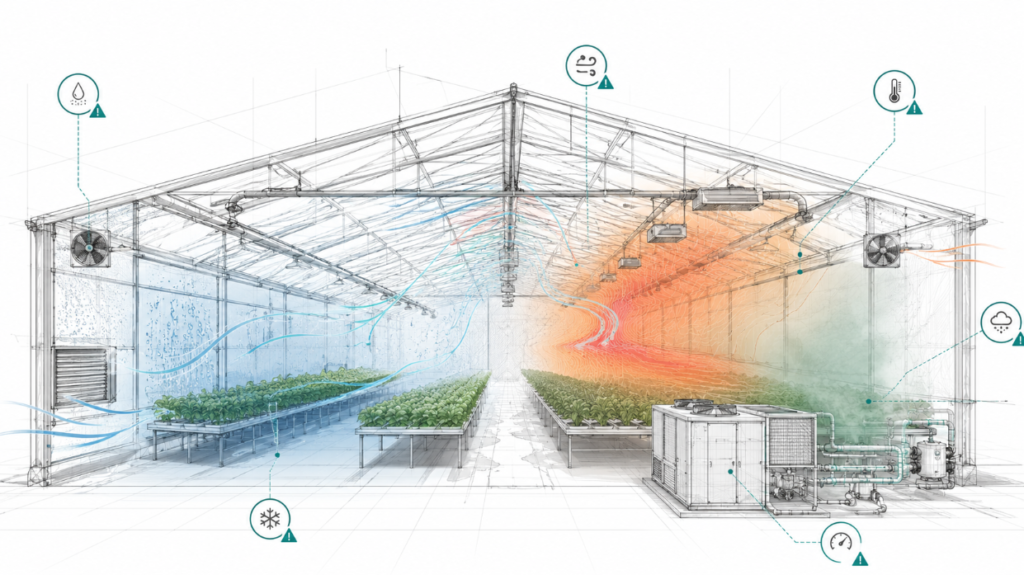
Humidity is one of the most difficult variables to manage in a commercial greenhouse, and one of the easiest to get wrong in a design that hasn’t been simulated. A structure sized correctly for heating and cooling can still struggle with humidity control, because the moisture load in a greenhouse doesn’t come primarily from outdoor air. It comes from the crop.
A mature tomato canopy transpires continuously during daylight hours, releasing water vapor into the greenhouse air at a rate that can exceed the moisture contribution of ventilation and infiltration combined. That load rises and falls with light levels, irrigation scheduling, and canopy density, and it interacts directly with the heating, cooling, and ventilation strategy covered earlier in this series. A dehumidification system sized without accounting for it is sized against the wrong number.
This is Part 4 of the Inside the Model series. Parts 1 through 3 covered dynamic thermal simulation, natural ventilation modeling, and HVAC system simulation. The thermal, airflow, and equipment performance data from those analyses feed directly into the humidity and environmental control analysis covered here.
What Humidity and Environmental Control Analysis Covers
- Ceres models humidity behavior within IESVE by combining the thermal and ventilation model with a time-based representation of crop transpiration, then evaluating the resulting latent load hour by hour across the operating year.
- Crop transpiration modeling: moisture output represented as a scheduled latent gain tied to light levels, growth stage, and irrigation strategy, rather than a flat daily average
- Latent and sensible load separation: distinguishing how much of the total load requires temperature control versus moisture removal, which determines dehumidification equipment selection
- Seasonal humidity behavior: how relative humidity and dew point shift across the year as outdoor conditions, ventilation rates, and crop transpiration change
- Condensation risk mapping: surface temperatures on glazing, structural members, and crop canopy compared against dew point to identify where and when condensation is likely to form
- Dehumidification strategy comparison: ventilation-based, mechanical, and hybrid dehumidification approaches modeled against the same latent load profile
- Interaction with ventilation and HVAC: how humidity control decisions affect, and are affected by, the ventilation and equipment strategies covered in Parts 2 and 3
Why Humidity Doesn’t Follow a Standard Load Calculation
Conventional building load calculations treat moisture as a secondary concern, addressed after temperature is resolved. In a greenhouse, that sequence doesn’t hold. The crop is a continuous, variable moisture source that operates on its own schedule, largely independent of when the mechanical system is working hardest to manage temperature. A greenhouse can be well within its cooling capacity and still accumulate humidity if the latent load hasn’t been evaluated separately from the sensible load.
Temperature and humidity are managed by different mechanisms, on different schedules. Modeling one without the other leaves the other one unresolved.
Crop transpiration as a continuous latent load
Ceres represents crop transpiration as a scheduled latent gain, tied to the same light and operating schedule used elsewhere in the model. Transpiration rises through the morning as light levels increase, peaks during the highest-light hours of the day, and tapers toward evening, continuing at a reduced rate overnight. Applying that load as a flat daily average instead of a time-based schedule produces a latent load profile that doesn’t reflect when moisture is actually being added to the space.
Seasonal humidity behavior
Humidity risk doesn’t peak on the same day as temperature risk. A cold winter night, with vents closed and the crop still transpiring at a reduced rate, can produce a higher relative humidity condition than a summer afternoon with high ventilation rates moving large volumes of drier outdoor air through the space. Modeling the full year, rather than a single design day, is what surfaces those off-peak humidity conditions before they become a seasonal pattern the operator has to manage manually.
Condensation risk
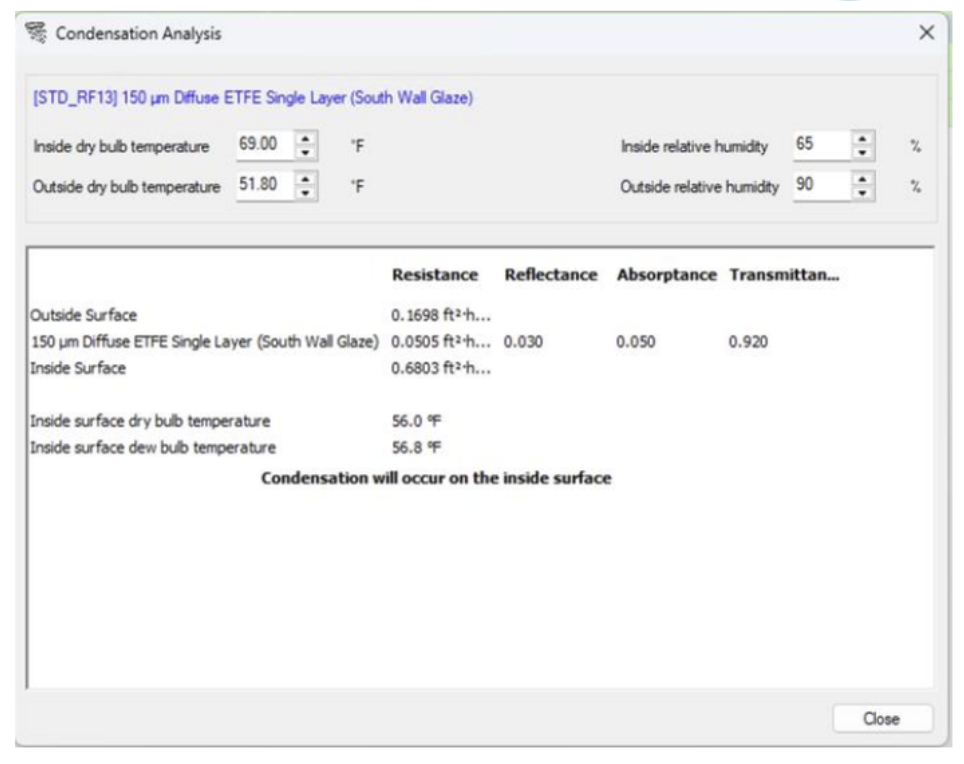
Condensation forms when a surface temperature drops below the dew point of the surrounding air. Ceres compares modeled surface temperatures on glazing, structural elements, and crop canopy against the modeled dew point across the year to identify where and when that’s likely to occur. Whether condensation is acceptable depends on the project’s requirements — some facilities tolerate it, others can’t due to crop sensitivity or structural concerns — and that threshold gets defined as part of the owner’s project requirements, then evaluated against the model.
Interaction with ventilation and dehumidification equipment
Humidity control rarely comes down to a single piece of equipment. Ventilation rate affects moisture removal and outdoor air exchange. Heating affects the air’s capacity to hold moisture without condensing. Mechanical dehumidification adds capacity but also adds heat. Modeling these together, rather than sizing each system against its own independent worst case, is what determines whether the combined strategy actually holds target conditions across the full range of operating conditions.
| Without humidity modeling | With humidity and environmental control analysis |
|---|---|
| Dehumidification sized from generic capacity tables | Dehumidification sized from modeled latent load profiles |
| Condensation risk assessed after it becomes a problem | Condensation risk mapped on glazing and structure before construction |
| Humidity treated as roughly constant year-round | Seasonal humidity behavior modeled hour by hour |
| Ventilation, heating, and dehumidification specified independently | Ventilation, heating, and dehumidification evaluated as an integrated system |
| Crop transpiration estimated or left out of the load calculation | Crop transpiration modeled as a time-based latent load |
| High-humidity zones identified through observation after occupancy | Stagnant, high-humidity zones identified in the model before construction |
What Does This Mean for Your Project?
Humidity and environmental control analysis affects equipment selection, disease risk management, and the long-term durability of the structure itself.
Dehumidification sizing
Equipment sized from a modeled latent load profile, rather than a generic capacity table, is matched to the moisture conditions the specific crop and climate combination is expected to produce. This affects both capital cost and how well the system holds target humidity during the shoulder-season conditions where most dehumidification runtime actually occurs.
Disease pressure risk
Elevated humidity and stagnant air are associated with increased fungal disease pressure in many greenhouse crops. Identifying the zones and time periods where humidity is likely to run high, before construction, informs both the environmental control strategy and the ventilation and circulation decisions covered in Part 2.
Glazing and structural condensation
Condensation that forms on glazing or structural members and isn’t managed can affect light transmission, create dripping onto the crop canopy, and contribute to material degradation over time. Mapping condensation risk during design gives the project team the option to adjust glazing selection, insulation, or control strategy before those consequences show up in an operating facility.
Research facility precision
For research greenhouses, humidity uniformity can be as important as temperature uniformity. A humidity gradient that’s acceptable in a commercial production context can compromise repeatability in an experimental one. Modeling identifies where that uniformity is and isn’t achievable under the proposed design.
Energy cost of humidity control
Dehumidification, whether mechanical or ventilation-based, has an energy cost. Modeling the latent load alongside the sensible load, as covered in Part 3, is what allows that cost to be evaluated as part of the overall HVAC specification rather than added as an afterthought once the mechanical system is already selected.
Control strategy
The simulation evaluates how humidity setpoints, ventilation staging, and dehumidification triggers interact across the year. That analysis informs the control sequence delivered with the system, rather than leaving humidity management to be tuned through trial and error after the facility opens.
Next in the series: sustainability, electrification, and utility incentives
Part 5 of Inside the Model covers how the same modeling foundation extends into electrification planning, heat recovery, renewable energy integration, and utility incentive documentation — the questions that come up once the thermal, airflow, HVAC, and humidity performance of a design are already understood.
| ALSO IN THIS SERIES Part 1 — Dynamic Thermal Simulation Part 2 — Natural Ventilation Modeling and CFD Airflow Analysis Part 3 — HVAC System Simulation: Real Performance vs. Nameplate Data Part 4 — Humidity and Environmental Control Analysis (this post) Part 5 — Sustainability, Electrification, and Utility Incentives |
| Ready to see your greenhouse modeled before you build it? Download the free Greenhouse Performance Guide — or speak with a Ceres engineer about your project. |
Or read more about Energy Modeling here.