Greenhouse owners increasingly need more than an operating cost projection. Lenders, institutional partners, and public-sector clients are asking for documented sustainability performance, a credible electrification pathway, and, in some cases, the technical basis for a utility rebate application. Those requirements are easiest to satisfy when they’re built into the same modeling work used to size the mechanical system, rather than assembled separately after design is complete.
Electrification decisions in particular depend on site-specific performance. A heat pump’s advantage over a gas system isn’t fixed. It depends on the outdoor temperature range at the project location and the load profile of the building — both of which are already established by the thermal and HVAC simulation covered earlier in this series.
This is Part 5, the final post in the Inside the Model series. Parts 1 through 4 covered dynamic thermal simulation, natural ventilation modeling, HVAC system simulation, and humidity and environmental control analysis. This post covers how that same modeling foundation extends into electrification planning, renewable energy integration, and utility incentive documentation.
What Sustainability and Electrification Modeling Covers
- Full electrification pathway modeling: comparing gas and heat pump systems, including Ceres’ proprietary GAHT® geothermal system, under the same site-specific load profile
- Heat recovery system design: quantifying how much heat and moisture can be recovered from exhaust ventilation air or process loads before it’s lost
- Renewable energy integration: PV generation potential modeled against the facility’s simulated hourly demand, rather than an annual average
- Carbon reduction scenario modeling: comparing operational emissions across system configurations using the same simulated energy consumption data developed for HVAC sizing
- Energy use intensity benchmarking: comparing modeled facility performance against industry reference points
- Utility rebate and incentive documentation: producing the modeled performance data that some utility programs require as part of an application
Why Electrification Performance Has to Be Modeled, Not Assumed
“Heat pumps are more efficient than gas” is a reasonable starting assumption, but it doesn’t transfer evenly across every site and climate. Heat pump performance is sensitive to outdoor temperature, and a greenhouse in a cold climate will spend a meaningful share of the heating season at outdoor temperatures well below the manufacturer’s rated test condition. The seasonal performance that actually matters for the project’s energy and cost projections comes from modeling that temperature distribution against the building’s load profile, not from the nameplate COP.
A heat pump’s rated efficiency describes one test condition. Its seasonal performance is determined by the climate and the load — and that has to be modeled, not assumed.
Heat pump and geothermal performance
For projects incorporating the GAHT® system, simulation plays a particularly important role. GAHT® exchanges heat with the ground at a relatively stable temperature, which gives it different performance characteristics than an air-source heat pump across the heating and cooling season. Modeling the interaction between geothermal exchange, the building’s thermal load, and any supplementary mechanical systems produces a complete picture of how the integrated system is expected to perform, rather than treating the geothermal contribution as a fixed offset.
Heat recovery and thermal storage
Commercial greenhouses generate more recoverable heat than is immediately obvious — from mechanical equipment, from process loads, and in some designs, from exhaust ventilation air. Modeling can quantify how much of that heat is recoverable under the facility’s actual operating schedule, and whether buffer storage would let it be captured during the day and used later, when the heating demand is higher. That analysis is what turns heat recovery from a general good idea into a sized, justified piece of the mechanical design.
Renewable energy integration
The Climate Assessment developed in Part 1 already includes solar radiation data for the project site. That same data supports PV generation modeling, matched against the facility’s simulated hourly electrical demand rather than an annual total. Matching generation to demand, hour by hour, is what determines how much of the facility’s load a proposed PV system can actually offset, and where a battery or grid-interactive strategy would close the remaining gap.
Carbon and energy benchmarking
Comparing system configurations on modeled operational emissions gives a project team a defensible basis for choosing between design alternatives, and gives funders and institutional partners project-specific figures rather than industry averages. The same energy use intensity data supports benchmarking the facility against comparable projects, which is increasingly part of what board approvals and public-sector reporting require.
| Without sustainability modeling | With sustainability and electrification modeling |
|---|---|
| Electrification feasibility assumed or estimated from datasheets | Heat pump and geothermal performance modeled across the full seasonal range |
| Heat recovery potential unquantified | Heat and moisture recovery savings quantified from simulated ventilation and process loads |
| PV sizing based on rough annual demand estimates | PV generation modeled against simulated hourly demand |
| Carbon reduction figures unsupported by project-specific data | Carbon reduction scenarios compared using simulated energy consumption |
| Utility rebate eligibility unclear until after design is finalized | Modeling outputs support rebate and incentive documentation where programs require it |
| Energy use intensity unbenchmarked | Facility EUI compared against modeled performance data |
What Does This Mean for Your Project?
Sustainability and electrification modeling affects technology selection, funding and reporting requirements, and long-term exposure to energy cost volatility.
Electrification feasibility
Modeling gives the project team a defensible, site-specific answer to whether full electrification is a realistic path for a given climate and load profile, rather than a general industry assumption applied without adjustment for the project’s conditions.
Heat recovery and thermal storage
Quantifying recoverable heat and the value of thermal storage before construction affects whether that infrastructure gets designed into the facility from the start, which is considerably less expensive than adding it later.
Renewable energy planning
PV sizing informed by simulated hourly demand supports a system sized to the load it will actually offset, rather than an installation sized to a rough annual estimate that may not align with when the facility is actually consuming power.
Utility rebate and incentive support
Some utility providers offer rebate and incentive programs for commercial facilities that document energy performance, and requirements vary by utility and program. Where documented modeling is part of the application, the simulation work Ceres produces as part of the design process is typically the technical foundation for it. Ceres supports clients through that documentation process.
ESG and sustainability reporting
For institutional and public-sector owners, modeled carbon and energy performance data supports the sustainability reporting and board-approval processes that increasingly accompany capital projects of this scale.
Long-term energy cost resilience
A facility with a modeled, defensible electrification and efficiency strategy is better positioned to manage exposure to future energy price changes than one designed around current fuel costs alone. Simulation doesn’t predict future utility rates, but it does establish how the facility’s consumption responds to different system configurations, which is the information needed to evaluate that exposure.
The Inside the Model Series: What We’ve Covered
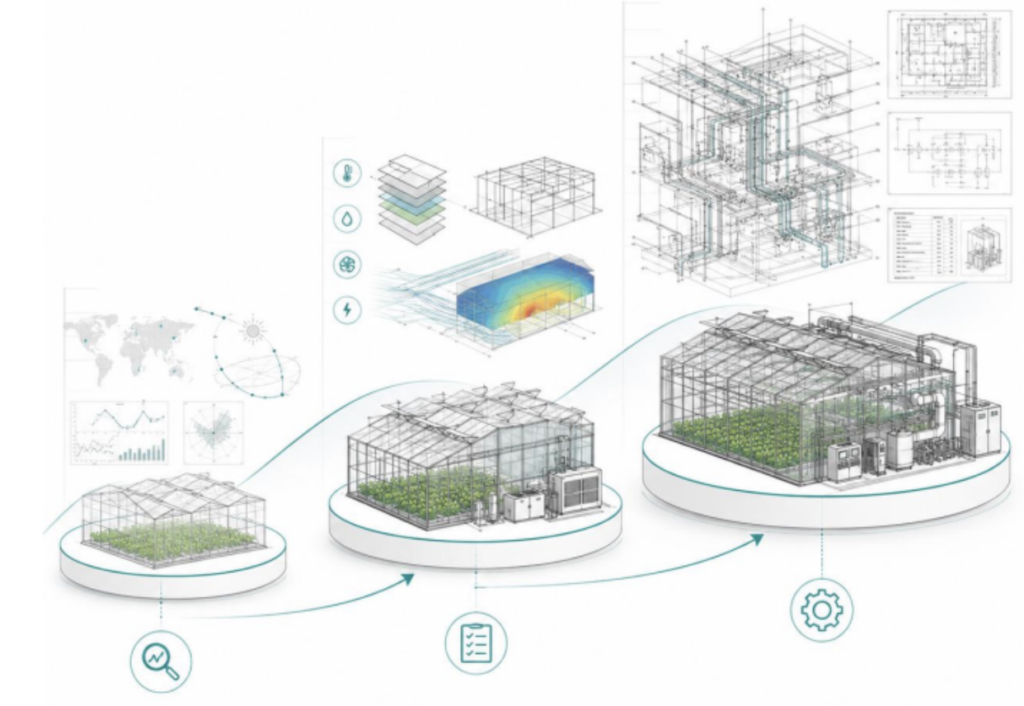
Across five posts, this series has followed the same modeling foundation from climate data through to final system specification: dynamic thermal simulation establishes how the building behaves under site-specific conditions; natural ventilation and CFD modeling evaluate how air actually moves through the space; HVAC system simulation models how mechanical equipment performs across the full operating year rather than at a single rated condition; humidity and environmental control analysis accounts for the crop as a continuous moisture source; and this post extends that same data into electrification, renewable energy, and incentive planning. Each stage uses the same underlying model, refined and extended as the project moves from concept toward construction.
| ALSO IN THIS SERIES Part 1 — Dynamic Thermal Simulation Part 2 — Natural Ventilation Modeling and CFD Airflow Analysis Part 3 — HVAC System Simulation: Real Performance vs. Nameplate Data Part 4 — Humidity and Environmental Control Analysis Part 5 — Sustainability, Electrification, and Utility Incentives (this post) |
| Ready to see your greenhouse modeled before you build it? Download the free Greenhouse Performance Guide — or speak with a Ceres engineer about your project. |
Or read more about Energy Modeling here.