Greenhouse ventilation design typically begins with a standard set of calculations — vent area sized to peak summer load, and openings and circulation fans positioned based on established practice. This approach addresses the conditions it is designed for, but ventilation demand in a working greenhouse is rarely that straightforward. External temperature, wind speed and direction, solar gain, internal heat loads, and crop canopy density are all continuously shifting, and they interact with one another in ways that static calculations do not fully capture.
Buoyancy, prevailing wind, canopy resistance, and the relationship between roof vents and sidewall openings all influence how air actually moves through the building, and that behavior can differ significantly from what a diagram assumes. Natural ventilation modeling and CFD airflow analysis allow Ceres to evaluate modeled airflow patterns across the full range of conditions a greenhouse experiences, before the structure is built.
This is Part 2 of the Inside the Model series. If you missed Part 1 on dynamic thermal simulation, it provides useful context on how climate data and thermal behavior feed into the ventilation analysis covered here.
Natural Ventilation Modeling
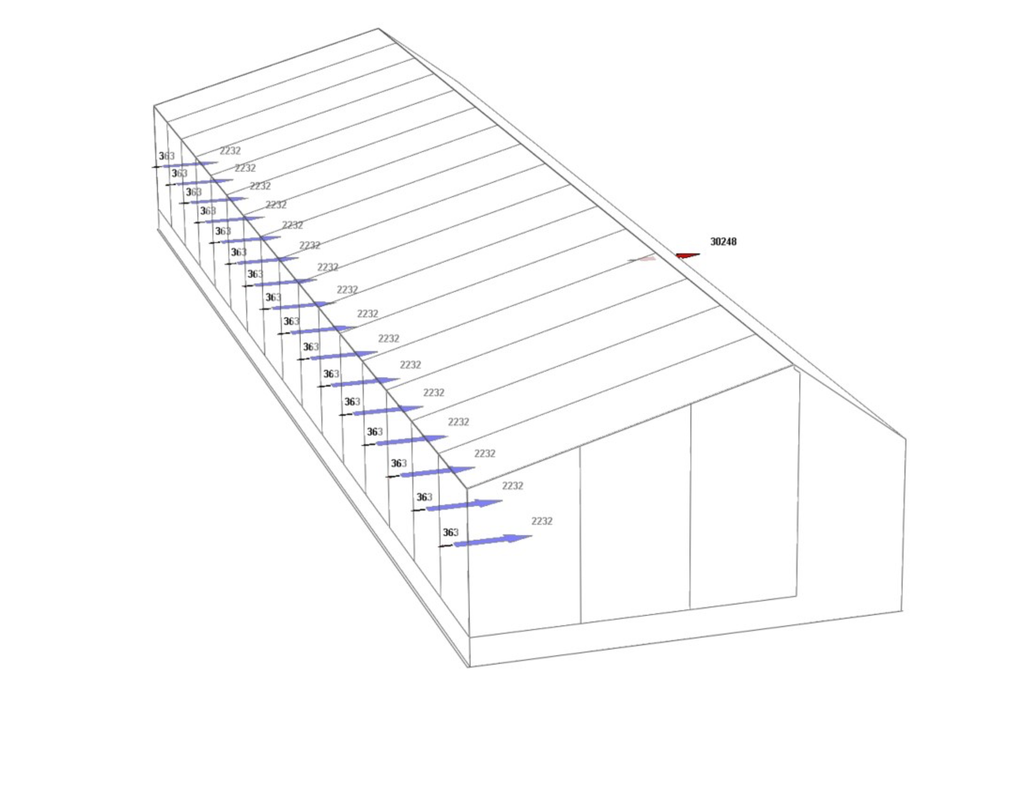
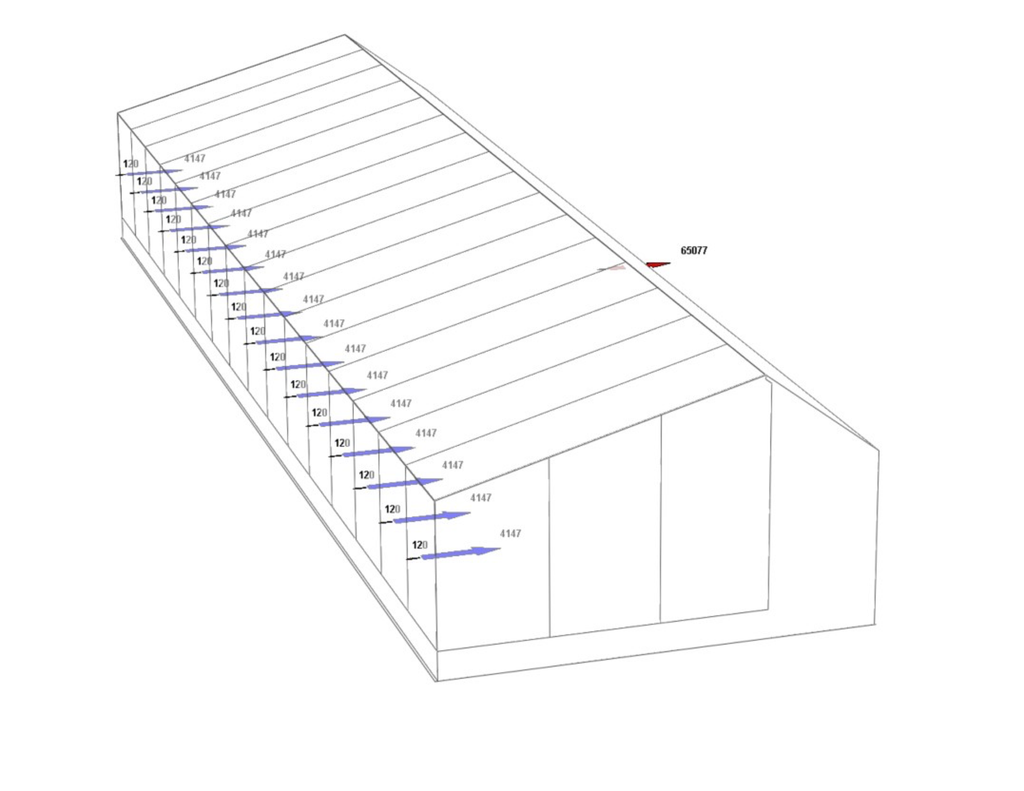
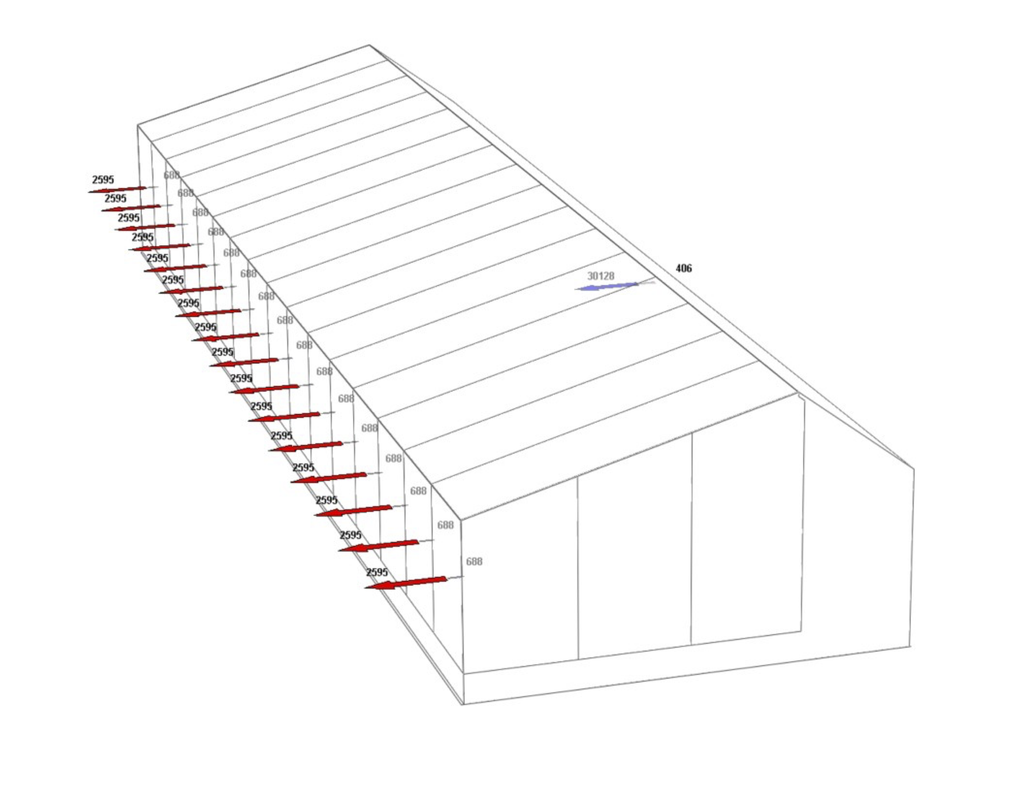
Natural ventilation modeling simulates how air moves through a greenhouse driven by buoyancy and wind, the two primary forces behind passive cooling. The model accounts for roof vent geometry, placement, and opening area; sidewall louver configuration and height; the prevailing wind direction and speed for the project site; and the internal temperature difference between the greenhouse air and the outside environment.
The output establishes, for a specific vent configuration, location, and climate, how much air moves through the building under the modeled conditions and whether that is sufficient to meet the ventilation requirement.
CFD Airflow Analysis
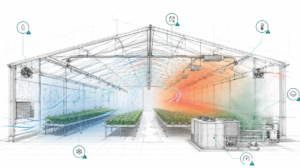
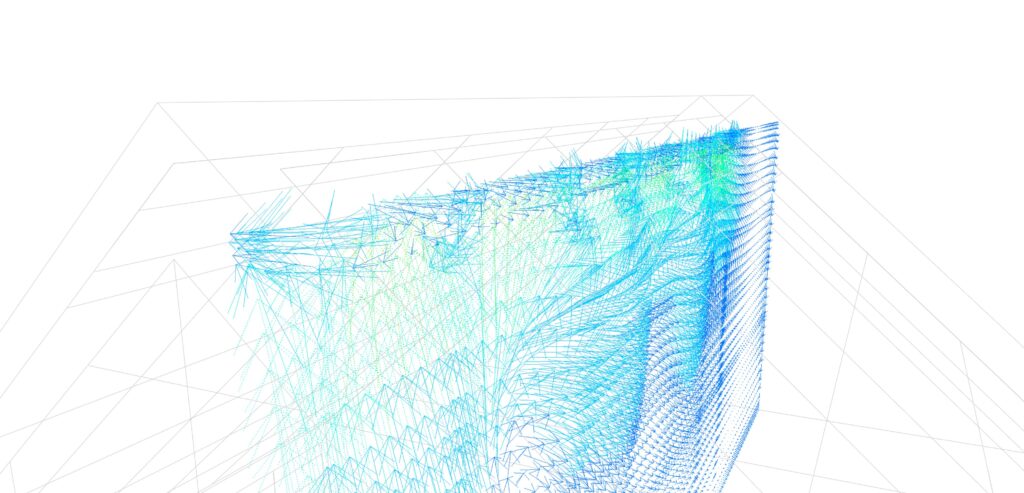
Computational fluid dynamics (CFD) modeling takes the analysis one level deeper. Rather than calculating total airflow rates, CFD maps how air moves through the full three-dimensional volume of the greenhouse — at every point in the space, not just at the openings.
Ceres uses energy modeling to produce detailed airflow visualizations that show exactly where air travels, where it slows or stagnates, and what the temperature and velocity conditions are at crop level.
Airflow issues identified during CFD modeling can be addressed through design changes before construction. The same issues identified after construction require physical intervention to correct.
What CFD Airflow Analysis Reveals in a Commercial Greenhouse
CFD modeling evaluates where a ventilation strategy performs as designed and where it does not. The analysis typically surfaces the following:
Dead zones and stagnant air pockets
In many greenhouse configurations, certain areas receive limited air movement regardless of vent placement. Stagnant air at crop level is associated with elevated humidity, reduced transpiration, increased disease pressure, and temperature variation across the growing zone.
CFD modeling identifies these zones during the design process. On a number of projects, the results have informed changes to vent placement, circulation fan configuration, or internal layout.
Thermal stratification
In a greenhouse with insufficient vertical air movement, heat accumulates at ridge level while conditions at bench or floor level differ. This stratification affects the accuracy of temperature sensors and the consistency of the growing environment.
CFD modeling shows where stratification occurs, how severe it is under different conditions, and whether the proposed circulation fan placement is sufficient to address it.
Crop canopy interaction
A dense crop canopy acts as a resistance to airflow. A model that does not account for this will overestimate how freely air moves through the growing volume. Ceres’ CFD analysis incorporates canopy resistance, producing results that reflect representative operating conditions rather than an unoccupied space.
Ventilation effectiveness under different conditions
A vent configuration that performs adequately under calm conditions may be less effective when wind direction or speed changes. CFD analysis evaluates ventilation performance across the range of wind speeds, wind directions, and internal temperature differentials the greenhouse will encounter.
| Without ventilation modeling | With natural ventilation + CFD modeling |
|---|---|
| Vent size estimated from rules of thumb | Vent area calculated from modeled airflow rates |
| Airflow assumed uniform throughout structure | Airflow mapped in 3D — dead zones identified and corrected |
| Cooling strategy decided before performance is known | Free-cooling potential quantified before mechanical system is specified |
| Fan placement based on experience and convention | Circulation fan configuration validated against CFD outputs |
| Humidity risk discovered during operation | Condensation and stagnation zones identified in the model |
| Mechanical cooling oversized to compensate for uncertainty | Equipment sized against simulation-confirmed free-cooling contribution |
Quantifying “Free-Cooling”
Natural ventilation modeling produces a quantified estimate of how much annual cooling demand can be met passively, without mechanical intervention. This is the free-cooling potential of the site and design, and it has a direct bearing on the size and cost of the mechanical cooling system.
In many climates and design configurations, natural ventilation can meet a portion of the cooling load during spring, autumn, and cooler summer periods. Simulation quantifies that contribution, providing the data needed to size mechanical systems for the load that passive ventilation cannot address.
This connects directly to the thermal simulation work described in Part 1 of this series. The free-cooling potential identified through ventilation modeling feeds into the HVAC sizing process, with implications for both equipment cost and long-term energy consumption.
What Natural Ventilation and CFD Modeling Cover
When Ceres runs a ventilation and airflow analysis for a project, the scope includes:
- Roof vent sizing and placement: modeled airflow rates for different vent configurations, sizes, and positions
- Sidewall louver optimization: how louver height, width, and position affect cross-ventilation and the interaction with prevailing winds at the site
- Free-cooling potential: quantified hours per year during which natural ventilation can maintain target temperatures without mechanical assistance
- Hybrid strategy evaluation: how natural and mechanical ventilation interact, and at what conditions the transition between them should occur
- 3D airflow visualization: CFD-generated maps showing air velocity, direction, and temperature at every point in the greenhouse volume, including at crop level
- Dead zone identification: stagnant areas that indicate disease pressure risk, humidity accumulation, or temperature variation
- Thermal stratification analysis: vertical temperature variation and the effectiveness of circulation fan configurations in reducing it
- Condensation risk mapping: areas where overnight temperature and humidity conditions create condensation risk on glazing, structure, or crop surfaces
What Does This Mean for Your Project?
Natural ventilation modeling and CFD analysis affect decisions that have direct cost and operational consequences for commercial greenhouse owners and research facility directors.
Vent specification
Vent area specification has a significant effect on greenhouse performance and is a decision that benefits from modeled airflow data rather than general calculation rules. Corrections to an under-vented structure after construction involve both capital cost and operational disruption.
Mechanical system sizing
The free-cooling potential identified through ventilation modeling informs the required capacity of the mechanical cooling system. A more accurate cooling load supports more appropriate equipment sizing, with corresponding effects on capital cost and part-load efficiency.
Fan placement and quantity
Circulation fan placement decisions are typically based on experience and established practice. CFD analysis evaluates whether the proposed placement addresses stratification and dead zones under real operating conditions, and identifies where repositioning would improve performance.
Research facility precision
For research greenhouses where environmental uniformity is a scientific requirement, CFD analysis is particularly valuable. Dead zones and temperature gradients that are acceptable in a production context can invalidate experimental results in a research setting. Modeling identifies these risks before the facility is built.
Disease pressure risk
Humidity accumulation in stagnant zones is associated with increased fungal disease pressure in commercial greenhouses. Modeling identifies those zones during the design process and informs ventilation and circulation strategies to reduce the risk.
Construction cost reduction
A ventilation deficiency identified through modeling can be corrected through a design change. The same deficiency identified after construction requires physical intervention, with associated capital cost and operational disruption.
Next in the series: HVAC system simulation
Part 3 of Inside the Model covers HVAC system simulation: how Ceres models the performance of heating, cooling, and dehumidification systems under real operating conditions, and how the difference between nameplate and simulated performance affects equipment specification. Read Part 3 when it’s live.
| ALSO IN THIS SERIES Part 1 — Dynamic Thermal Simulation Part 2 — Natural Ventilation Modeling and CFD Airflow Analysis (this post) Part 3 — HVAC System Simulation in Greenhouse Design: A Practical Overview Part 4 — Humidity and Environmental Control Analysis Part 5 — Sustainability, Electrification, and Utility Incentives |
| Ready to see your greenhouse modeled before you build it? Download the free Greenhouse Performance Guide — or speak with a Ceres engineer about your project. |
Or read more about Energy Modeling here.